Using Cartesian plots to visualize attribution of ‘skill’ vs ‘luck’
Stripping out randomness from performance data

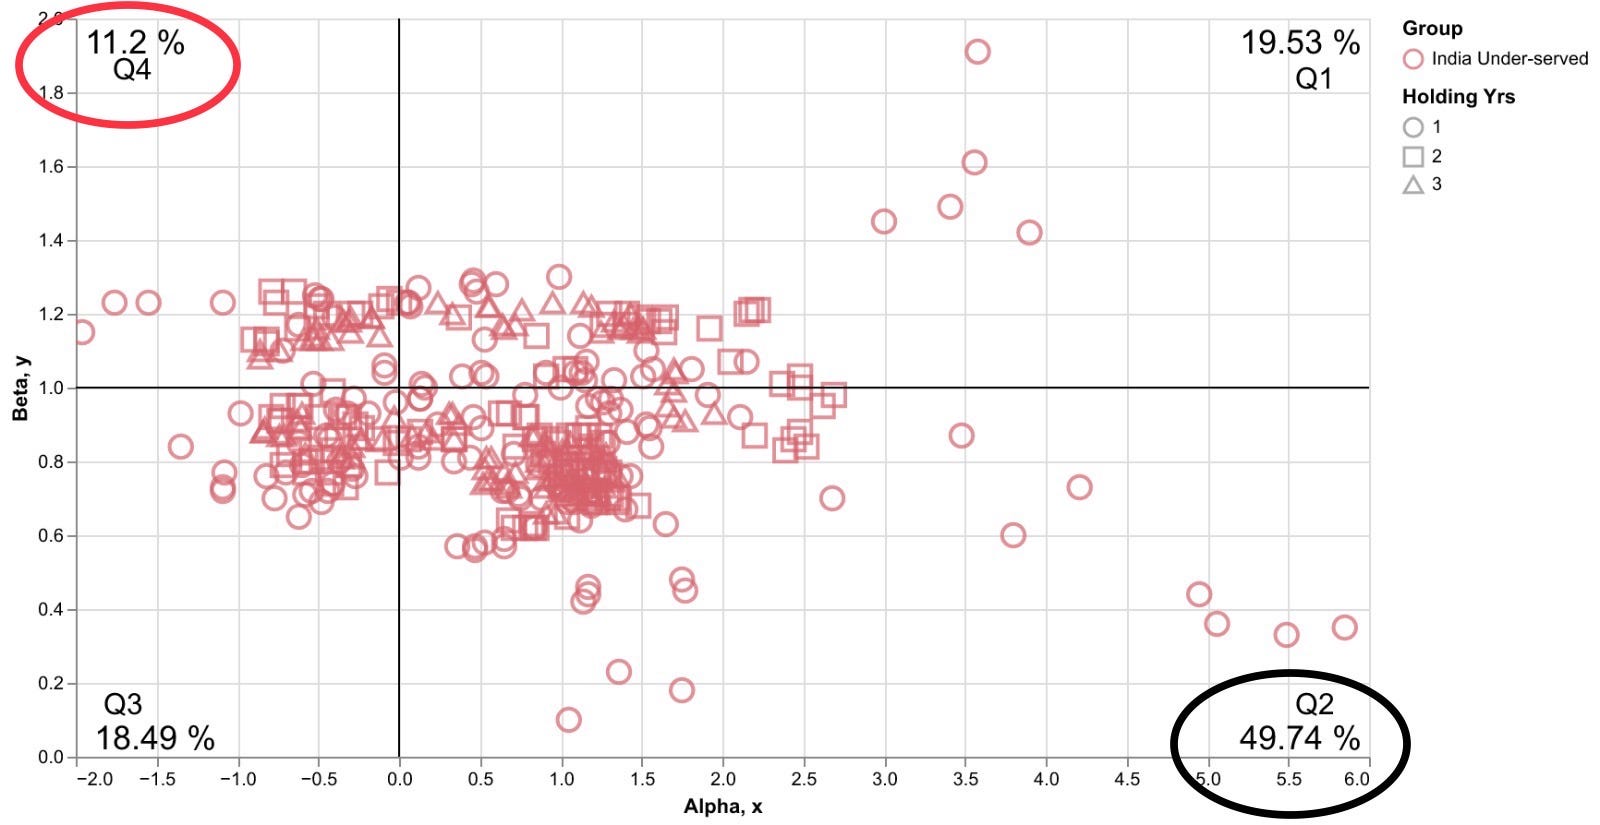
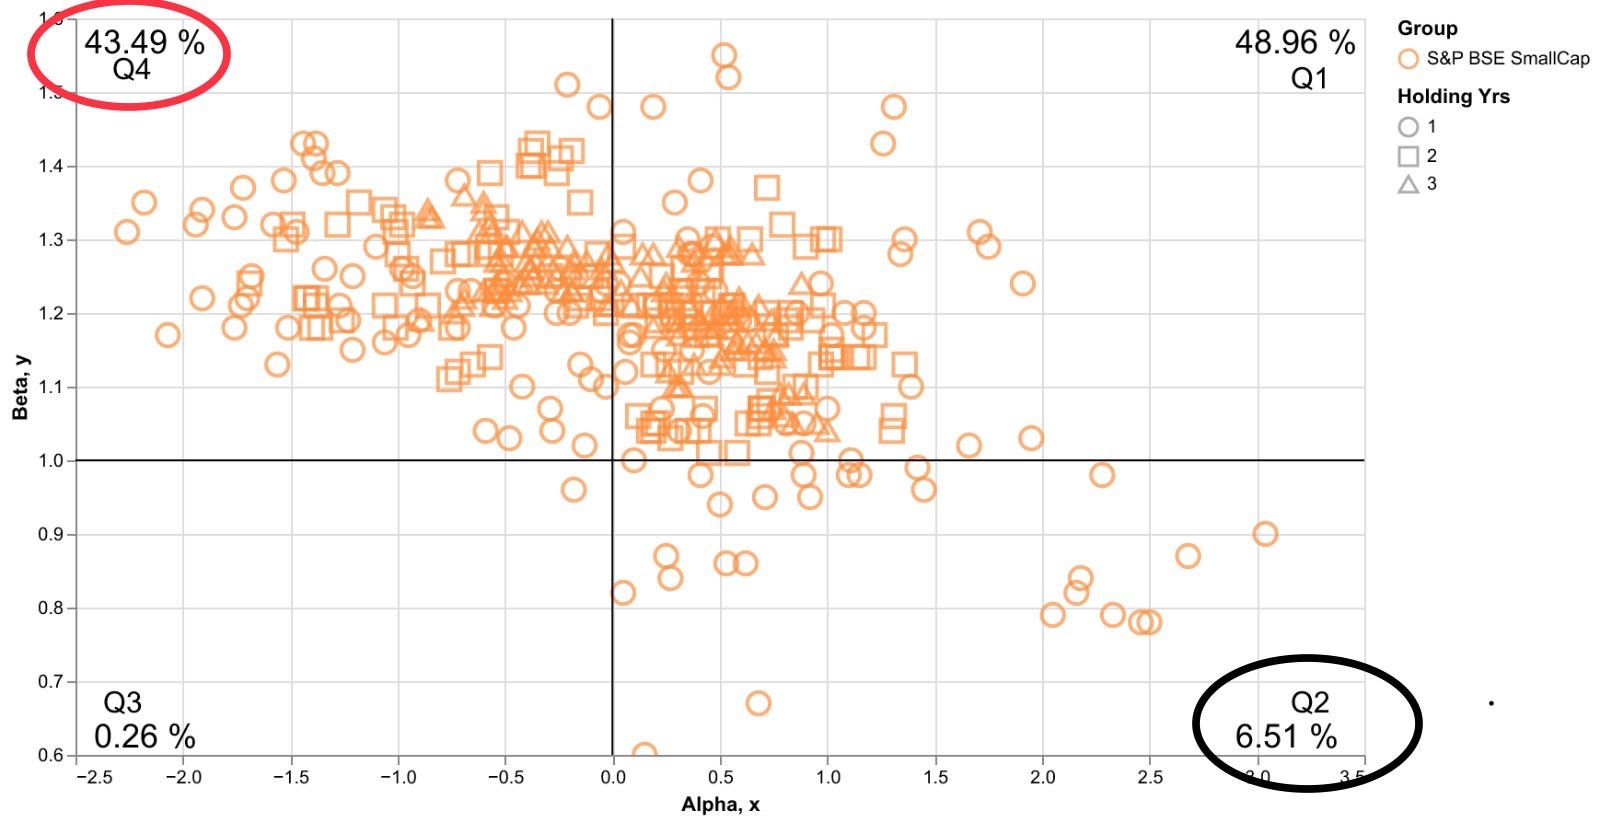
The biggest challenge for discerning allocators is to differentiate between skill and luck while evaluating past performance. Systemic attribution is critical in evaluating potential sustainability of performance. AlphaBlock performs quarterly simulations for Minerva India Under-served vs BSE Smallcap (using BSE 500 as the benchmark for both) for 1, 2, and 3 year holding periods (based on our since-inception data). In this post, we share Cartesian charts that show ‘’Alpha’ vs ‘Beta’ scatter plots. It is a nuanced approach to identify inherent skill in investment performance. Each plot is broken into four quadrants to help visualize distribution of outcomes.
The best strategies should show significant presence in the second quadrant (Q2), which shows significant alpha capture without over relying on the beta. Conversely, such strategies should ideally show low presence in the fourth quadrant (Q4), which indicates that the strategy did not have to rely on beta to deliver performance. We particularly note the following:
1. Nearly half of our outcomes fall in Q2, vs. <7% for BSE Smallcap. In contrast, barely 11% of our outcomes fall in Q4, vs. >40% for BSE Smallcap. Our reliance on beta to deliver performance is decidedly low.
2. Nearly 70% of our outcomes came with positive alpha. Importantly, less than a third of our outcomes came with beta of >1.
3. A more clustered plot in case of ‘India Under-served’ exhibits our ability to identify idiosyncrasies within a discretionary security selection construct.
Please reach out to Arpit Khunteta or Sourav Dutta to request more granular performance measures.