
Asymmetric rolling ‘capture’ numbers are useful in identifying style discipline in listed equity strategies

Post-pandemic, Indian allocators likely didn’t bother about an investment’s ‘down capture’. Their advisors likely didn’t bother either, and the ‘easier’ pleasant advice was the ‘preferred’ sell over the past 5 years. Rather disturbingly, during this period, how a strategy holds up during periods of liquidity drying up and associated drawdowns was barely even a subject within allocation decisions.
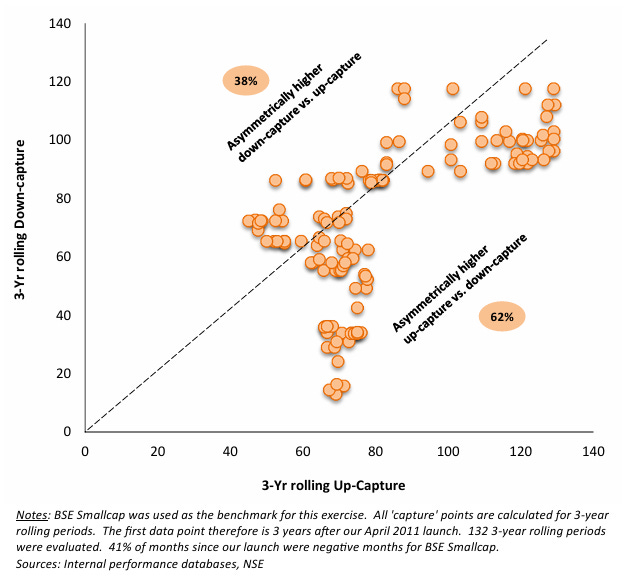
A rolling period plot of ‘Up’ vs ‘Down’ capture, particularly in case of long-tenured strategies, is generally a reasonably sound way of interpreting ‘capture’ metrics fairly (by taking an un-skewed look), vs. a standard since-inception measure of up-down capture. A mostly favorable rolling up-down capture often establishes consistency in underlying style. For instance, while Minerva India Under-served has since-inception ‘up capture’ of 81 and a ‘down capture’ of 68, this by itself doesn’t confirm whether our favorable up-down capture differential was skewed (or not) by certain periods. By itself, it fails to establish consistency. To address that, the attached exhibit plots our 3-year rolling ‘down capture’ (on y axis) vs. ‘up capture’ (on x axis) - The most telling strategy characteristic is that 62% of all observations over nearly 14 years of allocation fell in the asymmetrically high ‘up capture’ region (i.e. higher up-capture and lower down-capture) of the plot.
While flows in more discerning (read ‘more institutionalized’) markets respond positively to superior down-capture when broader sentiment is negative and/or valuations are very elevated, evidence in retail-driven markets such as India does not sync with this. Sensitivity to downsides in such markets is often overwhelmingly managed by shifting between asset classes, often overly exposing capital to market timing risks. Regardless, consistently positive differentials between ‘Up’ and ‘Down’ capture strongly indicate style discipline in listed equity strategies, and (arguably) superior security selection. To that extent, these are certainly useful measures in the hands of discerning allocators.
For our historical up/down captures across various time frames of your choice and vs. different benchmarks of your choice, please reach out to Deepak Gaur or Devchandra Ramani.
DISCLAIMER: The information, opinions, estimates and projections contained in this note were prepared by managers of Minerva India Under-served and constitute its current judgment as of the date of this note. The information contained herein is believed to be reliable and has been obtained from sources believed to be reliable, but we make no representation or warranty, either expressed or implied, as to the accuracy, completeness or reliability of such information. We do not undertake, and have no duty, to advise you as to any information that comes to our attention after the date of this fund brief or any changes in its opinion, estimates or projections. Prices and availability of securities are also subject to change without notice. This is not a prospectus and does not constitute investment advice or an offer or solicitation to buy or sell any designated investments discussed herein. Neither Minerva Asset Advisors, nor its officers, directors, agents, or employees make any warranty, express or implied, as to the suitability of any fund as an investment or of any kind whatsoever, or assumes any responsibility for, and none of these parties shall be liable for, any losses, damages, costs, or expenses, of any kind or description, arising out of this newsletter or your investment in any fund. You understand that you are solely responsible for reviewing any fund, its offering and any statements made by a fund or its manager and for performing such due diligence as you may deem appropriate, including consulting your own legal and tax advisers.